Analyzing trends - Streamlit and Covid BR
I really got excited working with Streamlit, so I decided to add a trend chart using some of the curves I usually use when analyzing the stock market. As expected, it was a piece of cake and the only thing I had to learn a bit was using Pandas to create moving averages.
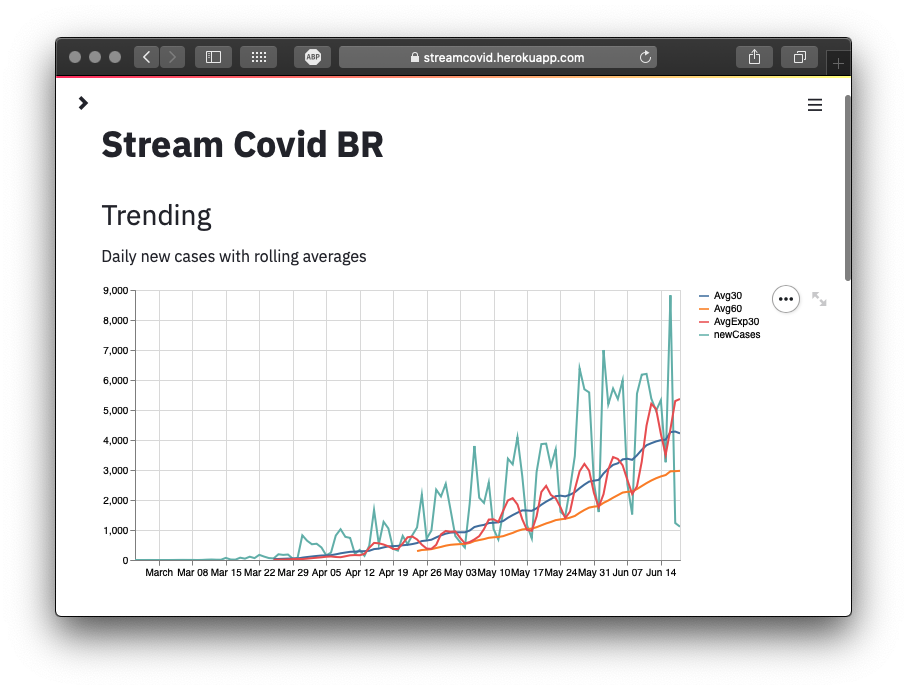
The code for adding the new chart was pretty much straightforward, I just had to do the calculation using Pandas before and then using the syntax-sugar Streamlit method line_chart:
total.loc[:, 'Avg60'] = total[col].rolling(window=60).mean()
total.loc[:, 'Avg30'] = total[col].rolling(window=30).mean()
total.loc[:, 'AvgExp30'] = total[col].rolling(window=30, win_type='exponential').mean(tau=1)
st.line_chart(total.loc[:, [col, 'Avg60', 'Avg30', 'AvgExp30']])
I also used the moment to move the controls for the trend chart and the map/bar chart to the sidebar, as you can check in the live application.
Limitations
There are two main limitations to the data we have:
- Limited number of tests. So the numbers don’t necessarily reflect the real situation in the country, but the trends can be helpful to understand the general behavior.
- Weekends usually have small numbers reported. I didn’t filter that out, so that stands out easily when checking the chart.
Trends
I like to use those 3 trends combine because they give an comparison between the long and short term behaviors, they are:
- Avg30/Avg60: Mean averages for 30 and 60 days windows (though for stock I use 100-day window). Represents the long term trend and is not easily affect daily – thus the weekend limitation doesn’t affect much.
- AvgExp30: Exponential averages for 30 days window. It gives more weight for newest data, so this give an insight in the sort term and is more affected by daily changes – see how it replicated the weekend effect.
Analysis
Looking at how the trends and the curve interact can give us some insights on how it behave in the past and what’s it is the trend for the future. The image above is for the Sao Paulo state data.
Trend is upward
As long as the Avg60 trend is respected and keeps pointing up, the overall trend will be new daily cases to grow. We can see that even with the weekend effect the Avg60 trend is well respected. The last two days (not weekends) had cases way below the trends, but we can’t say the trend has changed so far.
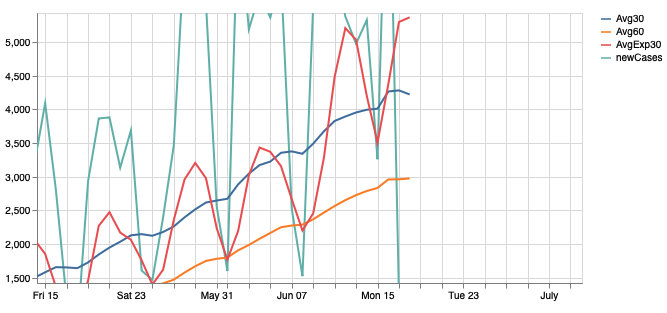
If we look closed, we can see that Avg60 has plato-ed in the last days and Avg30 is starting to point downwards. However AvgExp30 is still above Avg30, indicating some grow still. If AvgExp30 goes below Avg30 and Avg60, then we would be able to say that trend has changed to decrease in new cases. One problem though is that Covid-19 has up to 14 days incubation period plus the test result time, this way the data we see today represents more closely 2 weeks ago than today.
Checkout the application!
- Repository: https://github.com/gerson23/streamcovid
- Live app: https://streamcovid.herokuapp.com