Analyzing trends - 1.5th wave?
During the last 5 months since my last post, Brazil kept working poorly to control COVID-19 spread througout the contry but - helped by virus seasonality and some counter measures (masks, distancing) - we slowly go out the worse moment of the first wave. However, things are changing again. And not for better.
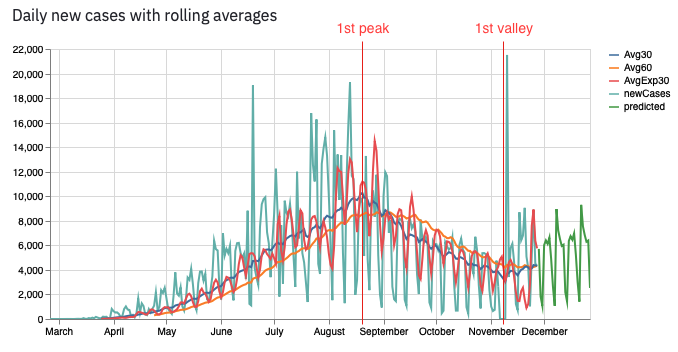
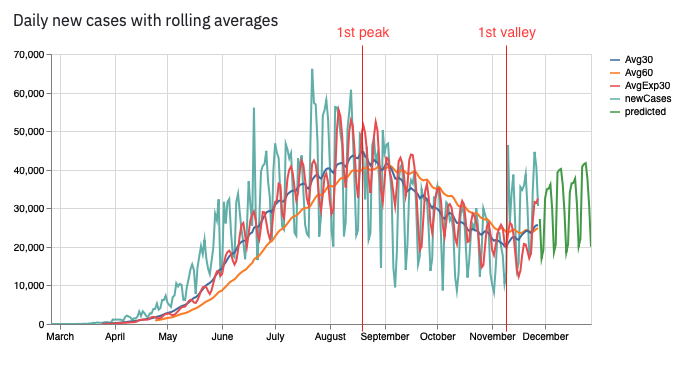
Below I have two charts extracted from my application comparing SP and Brazil. On SP we had a blackout of data during 4 days on November which caused the spike of notifications on November 10th. Though this had less impact on national numbers, we can see that the behavior is pretty much the same.
SP State daily notifications with peak and valley marked according to 30-day rolling average
Brazil daily notifications with peak and valley marked according to 30-day rolling average
Why a valley?
We currently have some indicators for an upward trend:
- 30-day rolling average is going up
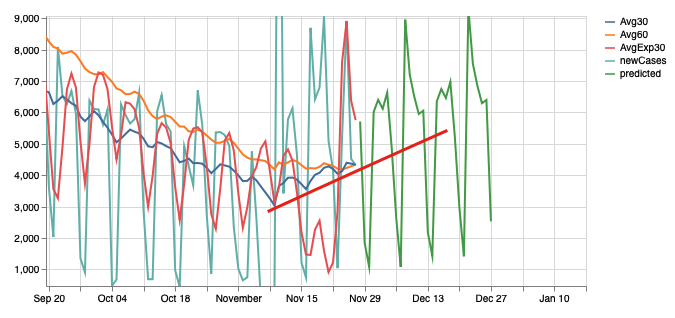
- 30-day rolling average crossing 60-day rolling average
- Exponential average crossing both arithmetic means
- Prediction from application machine learning pointing upwards
Another wave then?
Given those signs and experience from other countries - if there isn’t a good control (huge testing, traceability of infecteds, isolation), the virus come back eventually - we can say that we are on verge of a new wave of cases! I would just call it a 1.5th wave, because we didn’t really left the 1st wave so we could call it a 2nd this time.
Checkout the application!
- Repository: https://github.com/gerson23/streamcovid
- Live app: https://streamcovid.herokuapp.com